
systemd is a popular Linux utility to manage services & processes. However, sometimes you may find that a particular service managed by systemd is not functioning properly. In such cases, you need to use journalctl that can be used used to query journald, the logging facility of systemd. It allows you to query system boot information from journald to investigate when the said service was working well. In this article, we will look at a few handy journalctl commands to help you easily debug systemd issues.
How to Use Journalctl Command in Linux
Here is how to use journalctl command. You can simply enter the command as-is to get latest systemd log information.
$ journalctl
Here is a sample log entry.
Aug 21 07:59:22 bionicserver sshd[30779]: Protocol major versions differ for 192.168.1.50 port 58554: SSH-2.0-OpenSSH_7.6p1 Ubuntu-4ubuntu0.3 vs. SSH-1.99-OpenNMS_1.5
Each log entry consists of month, day and time, followed by system hostname, service name and PID of service. This is followed by actual journald information.
If there is an error, the keyword ‘error’ will be mentioned towards the end of log entry. Also it will be highlighted in red color, when you run journalctl. Here is an example.
Aug 21 07:59:22 bionicserver kernel: usb 2-1: can't set config #1, error -32
If you want to list only boot related entries, use -b option.
$ journalctl -b
This will show you the boot information about current boot, also numbered as 0. If you want to see the information related to previous boot use -1 after -b above.
$ journalctl -b -1
For information about boot before that use -2.
$ journalctl -b -2
This will help you compare information across different boots. For example, you can check the log entries for same service across different boots.
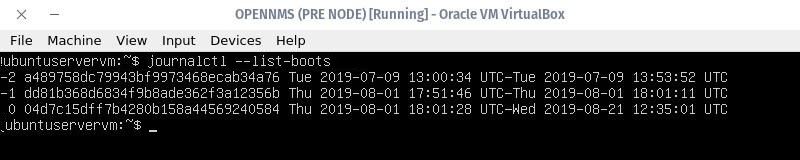
If you want to find out how many boots have happened run the following command.
$ journalctl --list-boots
You will see the list of boots as shown below.
View Journald logs by Time
If you want to view log entries by time, say, for past 1 hour, use –since option with the time frame mentioned in double quotes.
$ journalctl --since "1 hour ago"
You can also mention time frame in YYYY-MM-DD HH:MM:SS format to be more specific.
View Journald logs by service
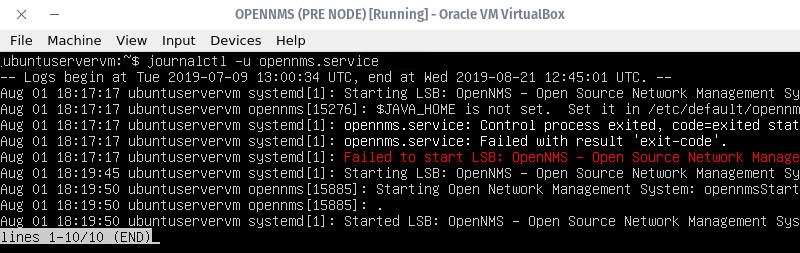
If you know the name of service you need to get information you can view its log entries with -u option followed by service name. Here is an example to view log entries of OpenNMS service.
$ journalctl -u opennms.service
You will see output as shown, including its error message, indicating there is some issue with it.
You may also format the output of journalctl command with -o option followed by one of the available formats. Here is the command to get output in json format.
$ journalctl -o json
Here are the available formats:
- json – show each journal entry in json format
- json-pretty – show each log entry in an easier-to-read json format
- verbose – detailed information for each entry
- cat – messages in very short form
- shortis – default, syslog, output format
- short-monotonic – similar to short, but includes time stamp value
That’s it. In this article, we have covered many important aspects of journalctl command that you can use to debug systemd logs and services.
Also read:
How to Grep Log File Within Specific Time
How to Password Protect Folders in Linux
Related posts:
How to Copy File Permissions & Ownership from Another File in Linux
SCP command in Linux to copy file from one server to another
How to Run Same Command Multiple Times in Linux
How to Disable Swap in Linux
How to Use Auto Indent in Vi Editor
Sed Command to Replace String in File
How to Save Dictionary to File in Python
How to Truncate File in Linux

Sreeram has more than 10 years of experience in web development, Python, Linux, SQL and database programming.